
Compiled by Nancy Brannon, Ph.D.
The mid-south has been experiencing “roller coaster” weather this winter,” e.g., January temperatures with highs in the 60s and 70s, to fast drops to the 20s and teens. Kentucky Equine Research reported on how these temperature swings can bring on colic in the horse. Since our horses do not live in “climate controlled” environments as humans do, it is important to look at trends in weather and temperature patterns and their relationship to global climate. All these factors can affect the health of our horses, as well as our own.
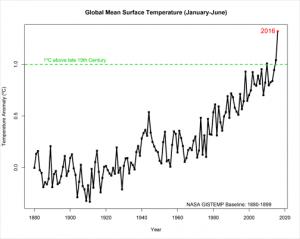
The year 2016 broke the record books as the hottest year on record, according to the National Aeronautics and Space Administration (NASA) analyses of ground-based observations and satellite data. In July 2016, NASA reported that each of the first six months of 2016 set a record as the warmest respective month globally in the modern temperature record, which dates to 1880, according to scientists at NASA's Goddard Institute for Space Studies (GISS) in New York. The six-month period from January to June was also the planet’s warmest half-year on record, with an average temperature 1.3 degrees Celsius (2.4 degrees Fahrenheit) warmer than the late nineteenth century.
NASA tracks temperature and sea ice as part of its effort to understand the Earth as a system and to understand how Earth is changing. In addition to maintaining 19 Earth-observing space missions, NASA also sends researchers around the globe to investigate different facets of the planet at closer range.
On January 18, 2017, the two leading U.S. science agencies, NASA and NOAA, jointly declared 2016 the hottest year on record, surpassing the previous record set in 2015 — which had topped a record set in 2014.
Average surface temperatures in 2016, according to the National Oceanic and Atmospheric Administration (NOAA), were 0.07 degrees Fahrenheit warmer than 2015 and featured eight successive months (January through August) that were individually the warmest since the agency’s records began in 1880, the Washington Post reported.
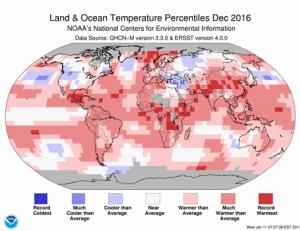
NOAA’s “State of the Climate” reported: “The globally averaged temperature over land and ocean surfaces for 2016 was the highest among all years since record keeping began in 1880. The December 2016 combined global land and ocean average surface temperature was the third highest for December in the 137-year record.
The average temperature across the world’s land and ocean surfaces was 58.69 Fahrenheit, or 1.69 degrees above the 20th-century average of 57 degrees, NOAA declared. The agency also noted that the record for the global temperature has now successively been broken five times since the year 2000. The years 2005 and 2010 were also record warm years, according to the agency’s data set, the Washington Post reported.
According to its data analysis, NASA found a bigger leap upward of temperatures in 2016, measuring the year as .22 degrees Fahrenheit higher than the prior record year of 2015. The agency also noted that since the year 2001, the planet has seen “16 of the 17 warmest years on record,” the Washington Post reported. Even though NASA and NOAA used somewhat different methodologies, both have concurred on identifying 2014, 2015 and 2016 as, successively, the three warmest years in their records.
According to the New York Times, “Since 1880, NOAA’s records show only one other instance when global temperature records were set three years in a row: in 1939, 1940 and 1941. The Earth has warmed so much in recent decades, however, that 1941 now ranks as only the 37th warmest year on record.
“The modern era of global warming began around 1970, after a long stretch of relatively flat temperatures, and the past three years mark the first time in that period that three records were set in a row. Of the 17 hottest years on record, 16 have now occurred since 2000,” NOAA has found.
Jonathan Overpeck, a climate scientist at the University of Arizona, noted that the stratosphere, the layer of the planet’s atmosphere stretching from about 8.5 to 13.5 miles above us, saw record cold temperatures last year. “The pattern of record warmth in the lower atmosphere, coupled with record cold in the stratosphere, provides a clear fingerprint of the cause of the unprecedented warming — greenhouse gases trapping heat in the lower atmosphere instead of letting it escape to the stratosphere, and then to space. No doubt about it anymore — humans, mainly by burning fossil fuels, are cooking the planet,” Overpeck said.
The EPA reports that “rising global average temperature is associated with widespread changes in weather patterns. Scientific studies indicate that extreme weather events, such as heat waves and large storms, are likely to become more frequent or more intense with climate change.
“Many extreme temperature conditions are becoming more common. Since the 1970s, unusually hot summer days (highs) have become more common over the last few decades in the United States. Unusually hot summer nights (lows) have become more common at an even faster rate. This trend indicates less “cooling off” at night. Although the United States has experienced many winters with unusually low temperatures, unusually cold winter temperatures have become less common—particularly very cold nights (lows). Record-setting daily high temperatures have become more common [in winter] than record lows.
“Total annual precipitation has increased over land areas in the United States and worldwide. Since 1901, precipitation has increased at an average rate of 0.08 inches per decade over land areas worldwide. However, shifting weather patterns have caused certain areas, such as the Southwest, to experience less precipitation than usual.
“Average drought conditions across the nation have varied since records began in 1895. The 1930s and 1950s saw the most widespread droughts, while the last 50 years have generally been wetter than average. However, specific trends vary by region. A more detailed index developed recently shows that over the period from 2000 through 2015, roughly 20 to 70 percent of the U.S. land area experienced conditions that were at least abnormally dry at any given time,” EPA data analysis shows.
NASA’s Earth Observatory report also explains how climate affects weather. In general, “global warming will result in more frequent hot days and fewer cool days, with the greatest warming occurring over land. Longer, more intense heat waves will become more common. Storms, floods, and droughts will generally be more severe as precipitation patterns change.”
“It is impossible to pin any single unusual weather event on global warming, but emerging evidence suggests that global warming is already influencing the weather. Heat waves, droughts, and intense rain events have increased in frequency during the last 50 years, and global warming likely has contributed to the trend,” according to NASA’s data analysis. A more detailed look at how climate affects weather patterns can be found at: http://earthobservatory.nasa.gov/Features/GlobalWarming/page6.php
Resources:
https://www.nasa.gov/feature/goddard/2016/climate-trends-continue-to-break-records
https://www.washingtonpost.com/news/energy-environment/wp/2017/01/18/u-s-scientists-officially-declare-2016-the-hottest-year-on-record-that-makes-three-in-a-row/?utm_term=.aaa218c6c80f
https://www.ncdc.noaa.gov/sotc/summary-info/global/201612
https://www.nytimes.com/2017/01/18/science/earth-highest-temperature-record.html
https://www.epa.gov/climate-indicators/weather-climate
http://climate.nasa.gov/effects/
The mid-south has been experiencing “roller coaster” weather this winter,” e.g., January temperatures with highs in the 60s and 70s, to fast drops to the 20s and teens. Kentucky Equine Research reported on how these temperature swings can bring on colic in the horse. Since our horses do not live in “climate controlled” environments as humans do, it is important to look at trends in weather and temperature patterns and their relationship to global climate. All these factors can affect the health of our horses, as well as our own.
The year 2016 broke the record books as the hottest year on record, according to the National Aeronautics and Space Administration (NASA) analyses of ground-based observations and satellite data. In July 2016, NASA reported that each of the first six months of 2016 set a record as the warmest respective month globally in the modern temperature record, which dates to 1880, according to scientists at NASA's Goddard Institute for Space Studies (GISS) in New York. The six-month period from January to June was also the planet’s warmest half-year on record, with an average temperature 1.3 degrees Celsius (2.4 degrees Fahrenheit) warmer than the late nineteenth century.
NASA tracks temperature and sea ice as part of its effort to understand the Earth as a system and to understand how Earth is changing. In addition to maintaining 19 Earth-observing space missions, NASA also sends researchers around the globe to investigate different facets of the planet at closer range.
On January 18, 2017, the two leading U.S. science agencies, NASA and NOAA, jointly declared 2016 the hottest year on record, surpassing the previous record set in 2015 — which had topped a record set in 2014.
Average surface temperatures in 2016, according to the National Oceanic and Atmospheric Administration (NOAA), were 0.07 degrees Fahrenheit warmer than 2015 and featured eight successive months (January through August) that were individually the warmest since the agency’s records began in 1880, the Washington Post reported.
NOAA’s “State of the Climate” reported: “The globally averaged temperature over land and ocean surfaces for 2016 was the highest among all years since record keeping began in 1880. The December 2016 combined global land and ocean average surface temperature was the third highest for December in the 137-year record.
The average temperature across the world’s land and ocean surfaces was 58.69 Fahrenheit, or 1.69 degrees above the 20th-century average of 57 degrees, NOAA declared. The agency also noted that the record for the global temperature has now successively been broken five times since the year 2000. The years 2005 and 2010 were also record warm years, according to the agency’s data set, the Washington Post reported.
According to its data analysis, NASA found a bigger leap upward of temperatures in 2016, measuring the year as .22 degrees Fahrenheit higher than the prior record year of 2015. The agency also noted that since the year 2001, the planet has seen “16 of the 17 warmest years on record,” the Washington Post reported. Even though NASA and NOAA used somewhat different methodologies, both have concurred on identifying 2014, 2015 and 2016 as, successively, the three warmest years in their records.
According to the New York Times, “Since 1880, NOAA’s records show only one other instance when global temperature records were set three years in a row: in 1939, 1940 and 1941. The Earth has warmed so much in recent decades, however, that 1941 now ranks as only the 37th warmest year on record.
“The modern era of global warming began around 1970, after a long stretch of relatively flat temperatures, and the past three years mark the first time in that period that three records were set in a row. Of the 17 hottest years on record, 16 have now occurred since 2000,” NOAA has found.
Jonathan Overpeck, a climate scientist at the University of Arizona, noted that the stratosphere, the layer of the planet’s atmosphere stretching from about 8.5 to 13.5 miles above us, saw record cold temperatures last year. “The pattern of record warmth in the lower atmosphere, coupled with record cold in the stratosphere, provides a clear fingerprint of the cause of the unprecedented warming — greenhouse gases trapping heat in the lower atmosphere instead of letting it escape to the stratosphere, and then to space. No doubt about it anymore — humans, mainly by burning fossil fuels, are cooking the planet,” Overpeck said.
The EPA reports that “rising global average temperature is associated with widespread changes in weather patterns. Scientific studies indicate that extreme weather events, such as heat waves and large storms, are likely to become more frequent or more intense with climate change.
“Many extreme temperature conditions are becoming more common. Since the 1970s, unusually hot summer days (highs) have become more common over the last few decades in the United States. Unusually hot summer nights (lows) have become more common at an even faster rate. This trend indicates less “cooling off” at night. Although the United States has experienced many winters with unusually low temperatures, unusually cold winter temperatures have become less common—particularly very cold nights (lows). Record-setting daily high temperatures have become more common [in winter] than record lows.
“Total annual precipitation has increased over land areas in the United States and worldwide. Since 1901, precipitation has increased at an average rate of 0.08 inches per decade over land areas worldwide. However, shifting weather patterns have caused certain areas, such as the Southwest, to experience less precipitation than usual.
“Average drought conditions across the nation have varied since records began in 1895. The 1930s and 1950s saw the most widespread droughts, while the last 50 years have generally been wetter than average. However, specific trends vary by region. A more detailed index developed recently shows that over the period from 2000 through 2015, roughly 20 to 70 percent of the U.S. land area experienced conditions that were at least abnormally dry at any given time,” EPA data analysis shows.
NASA’s Earth Observatory report also explains how climate affects weather. In general, “global warming will result in more frequent hot days and fewer cool days, with the greatest warming occurring over land. Longer, more intense heat waves will become more common. Storms, floods, and droughts will generally be more severe as precipitation patterns change.”
“It is impossible to pin any single unusual weather event on global warming, but emerging evidence suggests that global warming is already influencing the weather. Heat waves, droughts, and intense rain events have increased in frequency during the last 50 years, and global warming likely has contributed to the trend,” according to NASA’s data analysis. A more detailed look at how climate affects weather patterns can be found at: http://earthobservatory.nasa.gov/Features/GlobalWarming/page6.php
Resources:
https://www.nasa.gov/feature/goddard/2016/climate-trends-continue-to-break-records
https://www.washingtonpost.com/news/energy-environment/wp/2017/01/18/u-s-scientists-officially-declare-2016-the-hottest-year-on-record-that-makes-three-in-a-row/?utm_term=.aaa218c6c80f
https://www.ncdc.noaa.gov/sotc/summary-info/global/201612
https://www.nytimes.com/2017/01/18/science/earth-highest-temperature-record.html
https://www.epa.gov/climate-indicators/weather-climate
http://climate.nasa.gov/effects/


